Annual unaffordability growth accelerated from September to October
By Patrick Kearns | Nov 4, 2021
View data for all metros
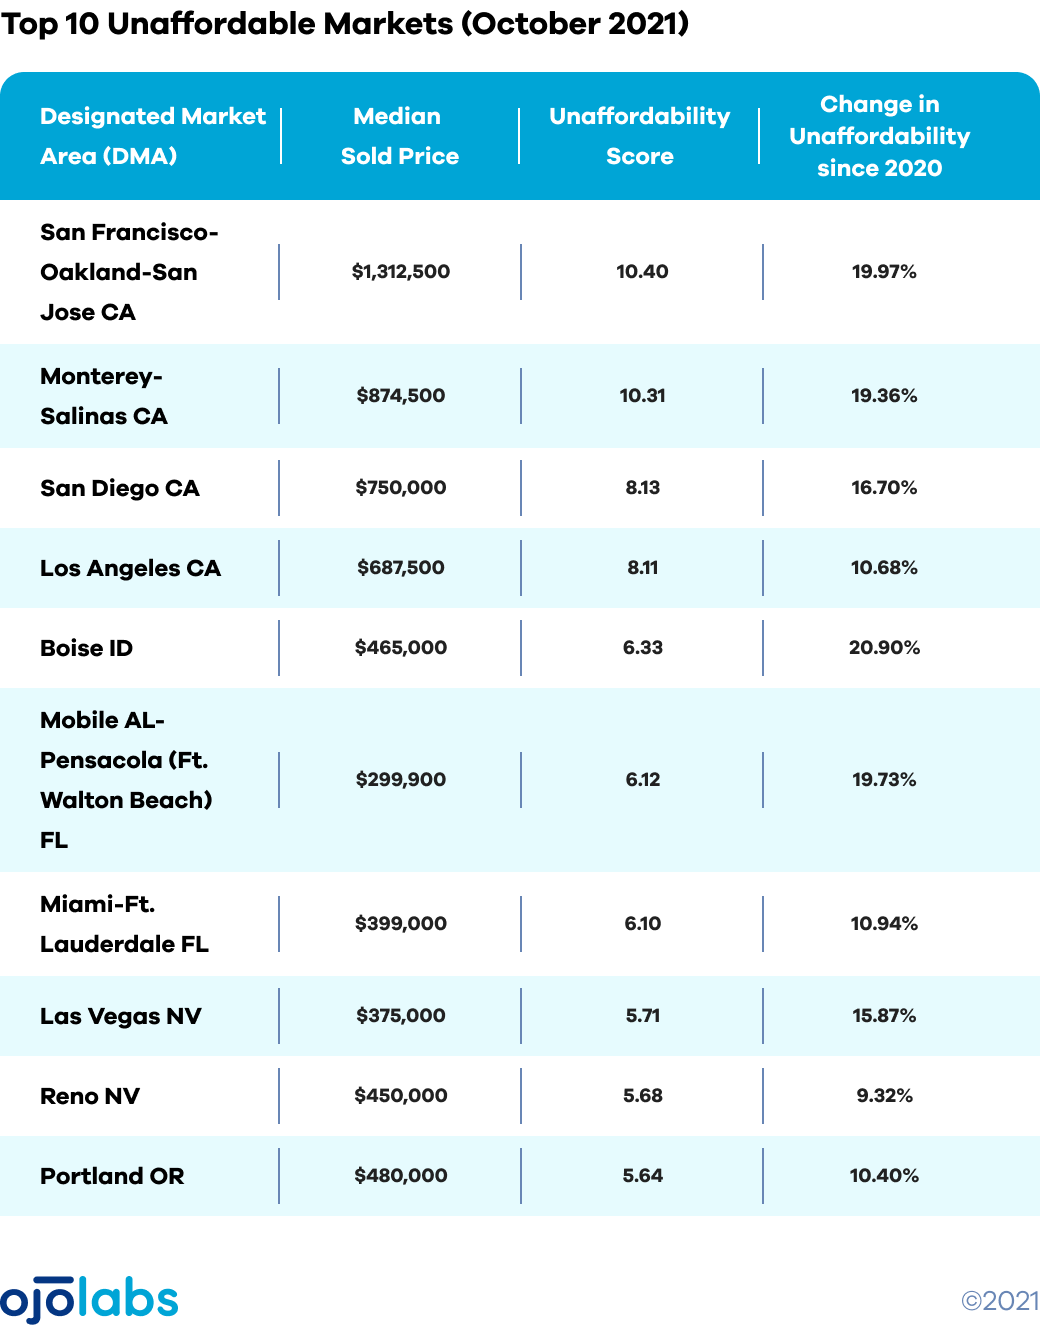
While the nation’s four least affordable cities are all in California, it’s Boise, Idaho, that’s seen the biggest jump in unaffordability of the nation’s 10 most unaffordable metro areas, according to new data released by real estate technology company OJO Labs.
The median home sold price in Boise reached $465,000 in October, a month-over-month increase of 3.3% and a year-over-year increase of 27.4%. When you factor in the rise in median household income, Boise — the nation’s fifth most unaffordable metro in October — actually outpaced San Francisco, Monterey, Los Angeles, and San Diego in terms of unaffordability score growth. Unaffordability score is a ratio calculated by dividing the median home sold price by the median household income.
Boise saw its unaffordability score climb 20.9% year over year in October to 6.3, compared to 19.9% for the San Francisco-Oakland-San Jose metropolitan area, the second highest year-over-year leap of the top 10 most unaffordable metros. The latter was also the least affordable metro in the U.S., with median home sold price hitting $1,312,500 and the unaffordability score hitting 10.4.
Perhaps the most surprising metro in the top 10 was the Mobile, Alabama and Pensacola, Florida metropolitan area, which, despite boasting a median home sold price of $299,900, was reported as the fifth most unaffordable metro area, ahead of metros like Miami, Florida; Las Vegas in Nevada; and Portland Oregon.
The data — which examined every metro area in which more than 1,000 homes were sold in October — showed that Myrtle Beach, South Carolina, saw the biggest increase in unaffordability score of the 76 metro areas in which more than 1,000 homes were sold in October. The median sold home price climbed to $249,700 in October, a year-over-year increase of 98.3%, which drove its unaffordability score to increase 96.4% year over year.
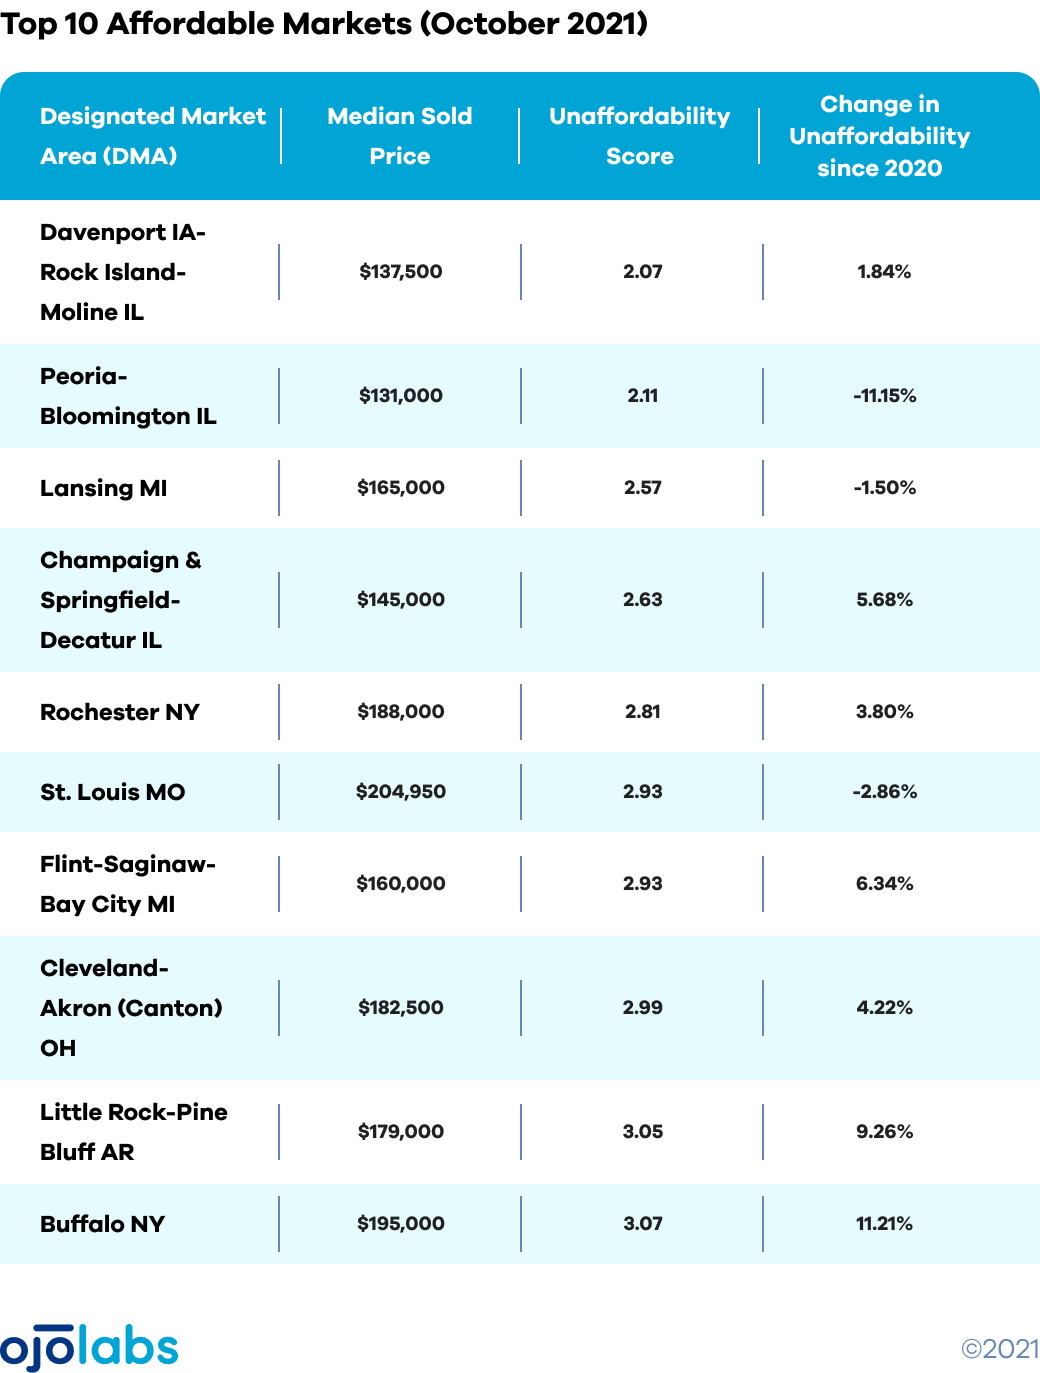
Baltimore, Maryland, saw the biggest increase in affordability for the second consecutive month, meaning it was easier to afford a home in October than it was at this time last year. The median home price in the metro fell 4.6% year over year, moving the unaffordability score down 6.9%.
The unaffordability score, on a national level, increased slightly from September to October and annual growth also accelerated from September to October, signaling that a potential deceleration in home prices is still far off and any small changes are likely due to seasonality. The median home price was up 0.9% month-over-month.
On an annual basis, the unaffordability score increased 11.8% year-over-year meaning it was much harder to afford a home in October 2021 than in October 2020 across the United States — due largely in part to a 16.3% year-over-year increase in median home price.
.png?upscale=true&width=1120&upscale=true&name=Desktop%20-%20OJO%20Home%20Center%20(3).png)
.png?upscale=true&width=1160&upscale=true&name=Group%201909%20(4).png)

%20(1).png?upscale=true&width=220&upscale=true&name=OJO_Circle%20(1)%20(1).png)